
2025
“What’s on your mind?” “What’s happening?”
Wherever you go on social media, you are prompted to disclose how you feel about an endless stream of content through likes, reactions, and text. No matter how you feel, these responses are fed back to you as algorithmic recommendations meant to keep you scrolling. To find our way out of these feedback loops, we need more than different questions.
The Image and Affect tool invites participants to reflect upon the ways that emotion and affect are computed by dominant social media environments. Developed as part of the Data Fluencies project, the Image and Affect tool is an anti-sentiment analysis web platform that provides users means to map their affective responses to online images outside of the extractive and manipulative enclosures of social media platforms. The interpretations of these affective mappings are then left to the user to visualize and share on their own terms.
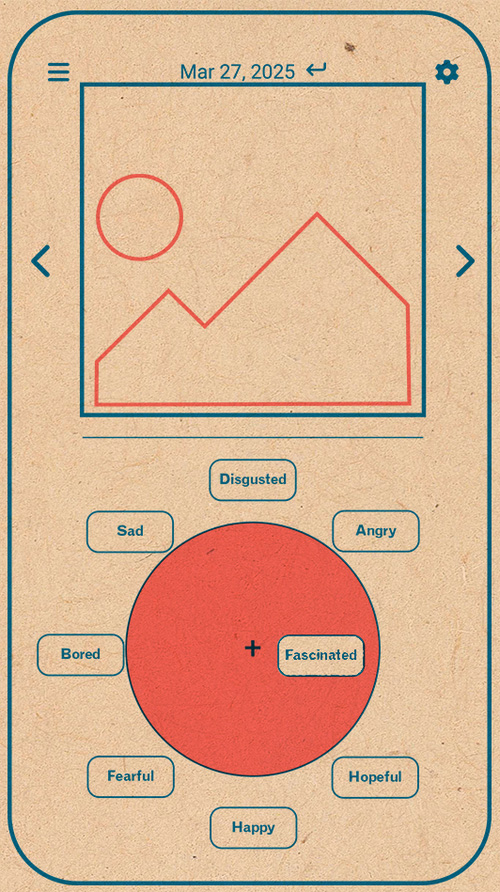
The Image-Affect tool allows you to upload recordings of your scrolling sessions. It uses a scraping algorithm to extract images from this recording and provides you with a wheel of affects and a sliding scale of intensity. For each image, you can drag and drop your affects - the closer to the centre, the more intense the affect. You can add as many affects as you want or leave the wheel empty. You can come back and change your mind. You can lie about how you feel if you want. Only you can understand what you were thinking and feeling as you were tagging. Only you can reassemble the data you create as a meaningful interpretation of your feelings. We invite you to be playful and trust your intuition - you might realize that what you actually feel is very, very different from what you think you should feel.
Typically, the power to visualize and interpret the data generated by our affective experience online is withheld from social media users. A monopoly of the platform, the archive of affects recorded through sentiment analysis and affective computing define how your data are valued and fed back to you as algorithmic recommendations. Our custom software remediates this process, offering users a toolset to aggregate and analyze the data catalogued by uploading and tagging content.
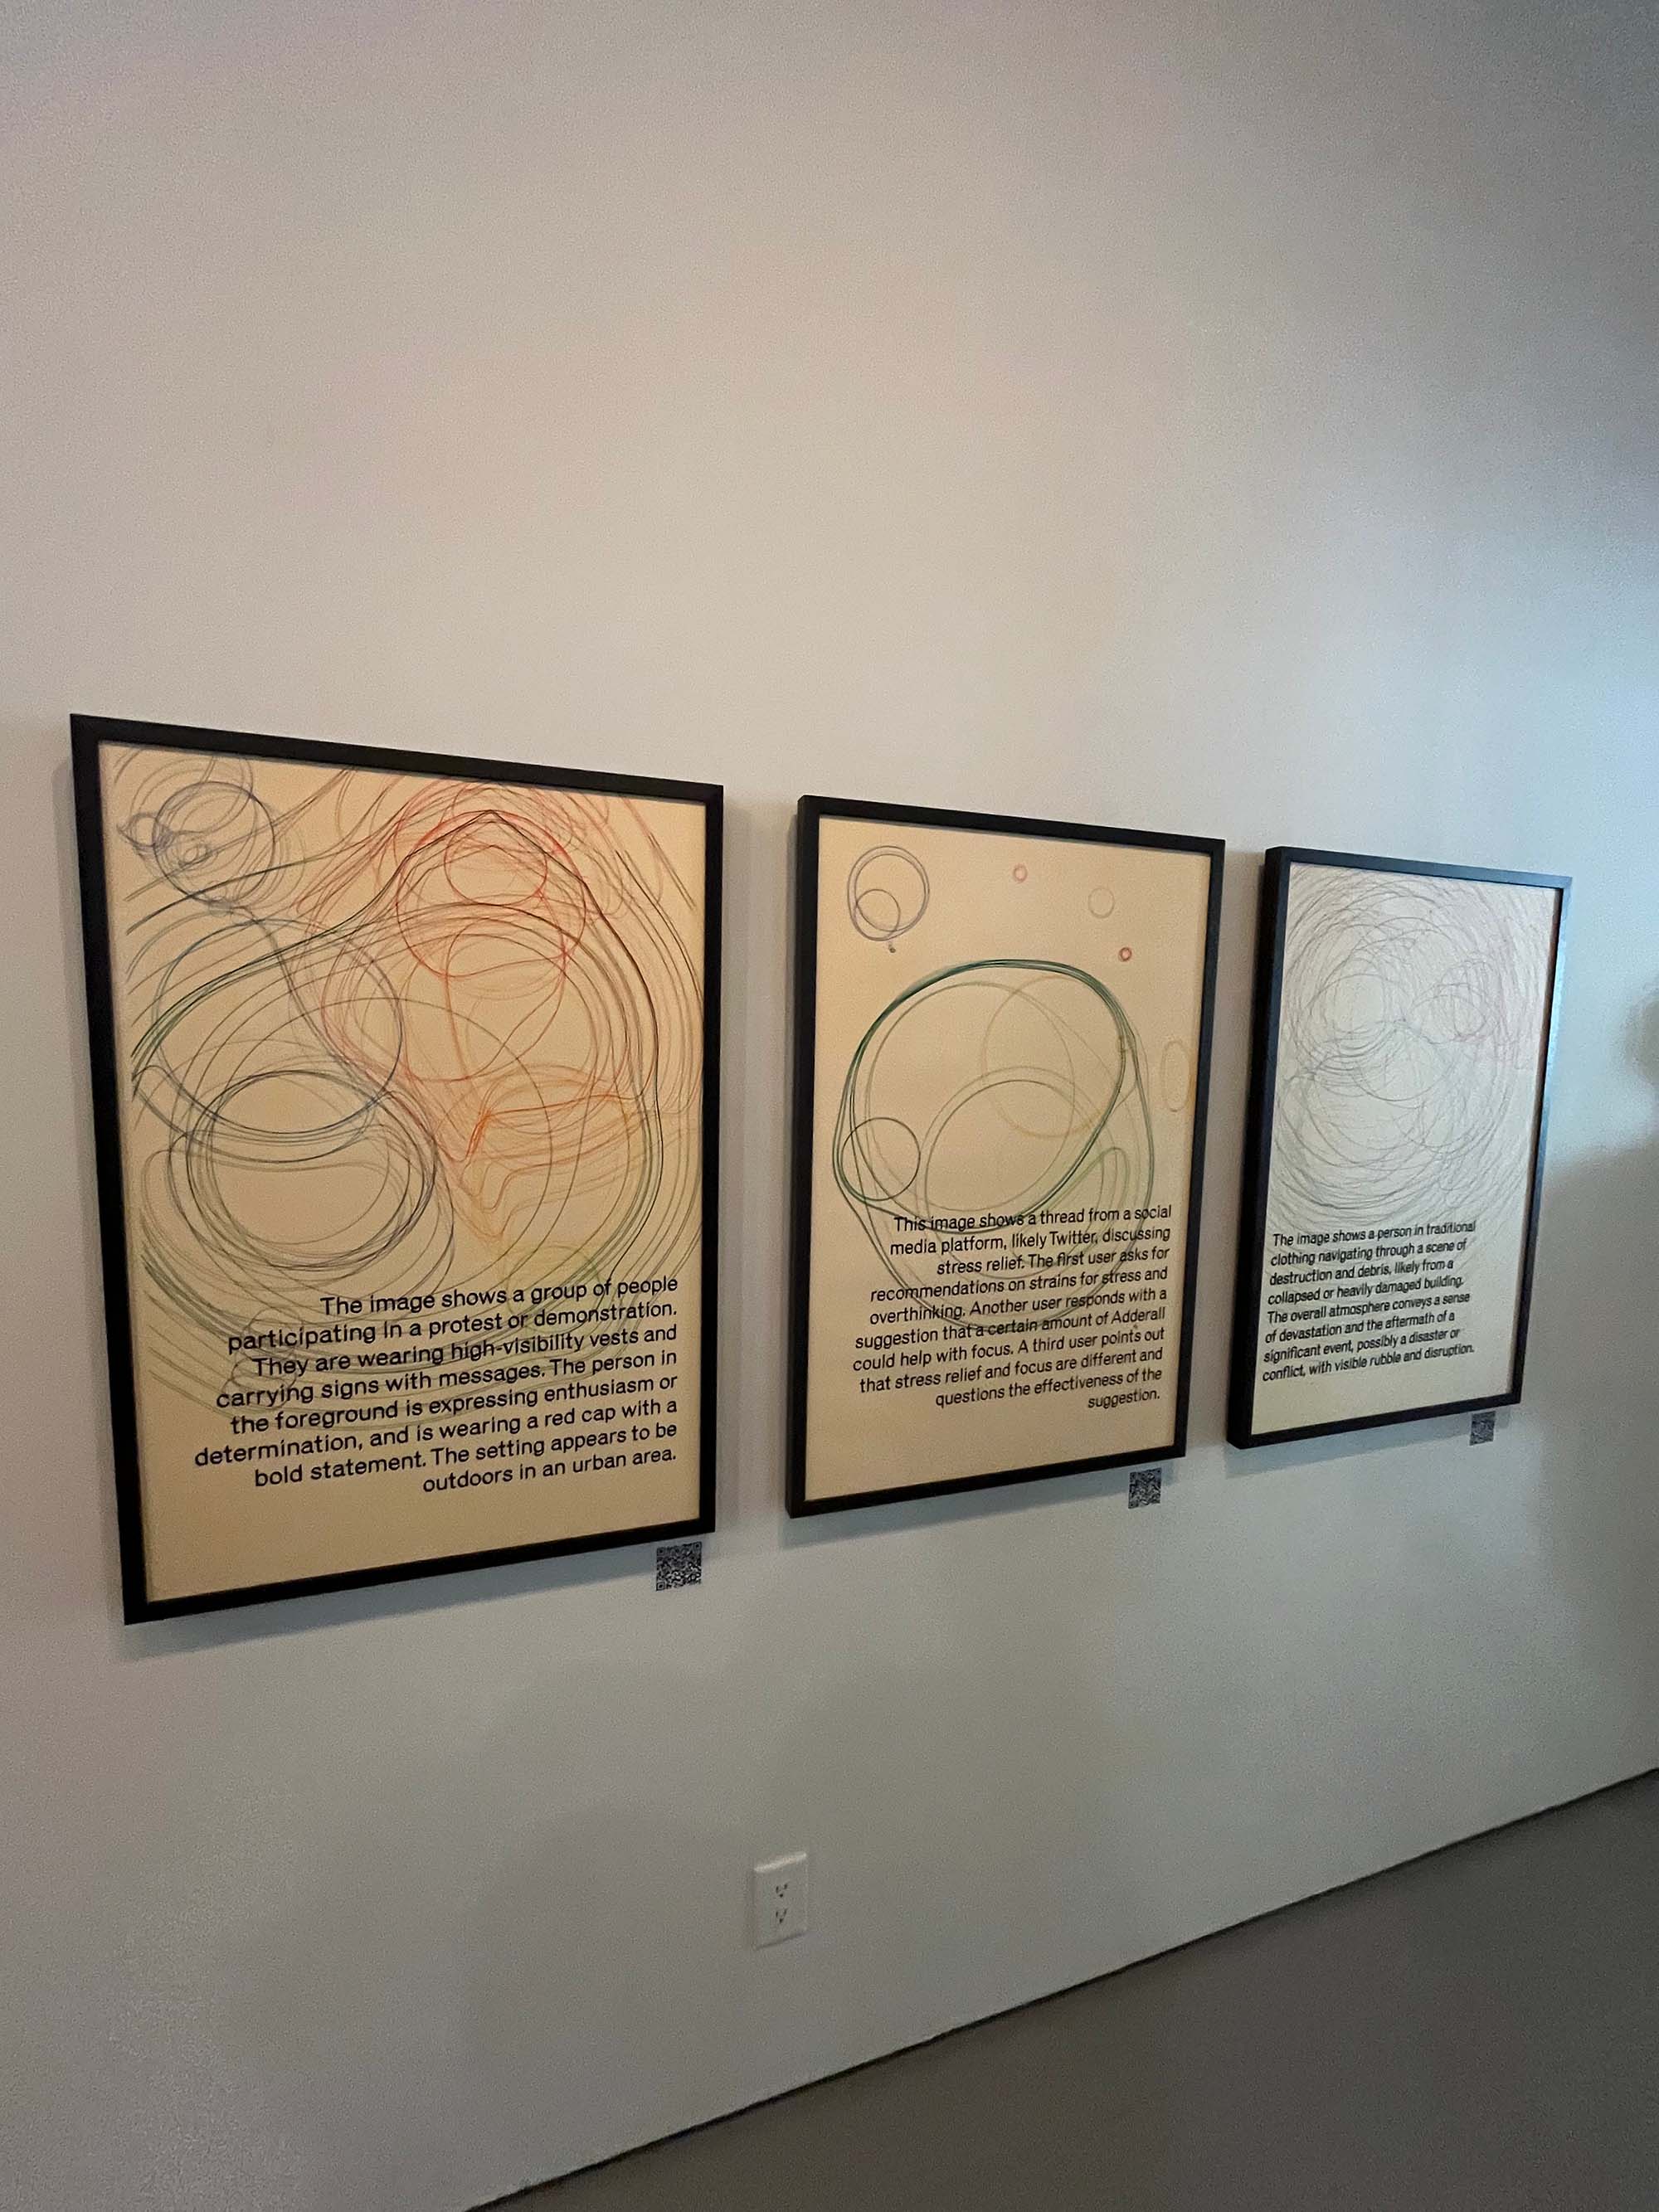
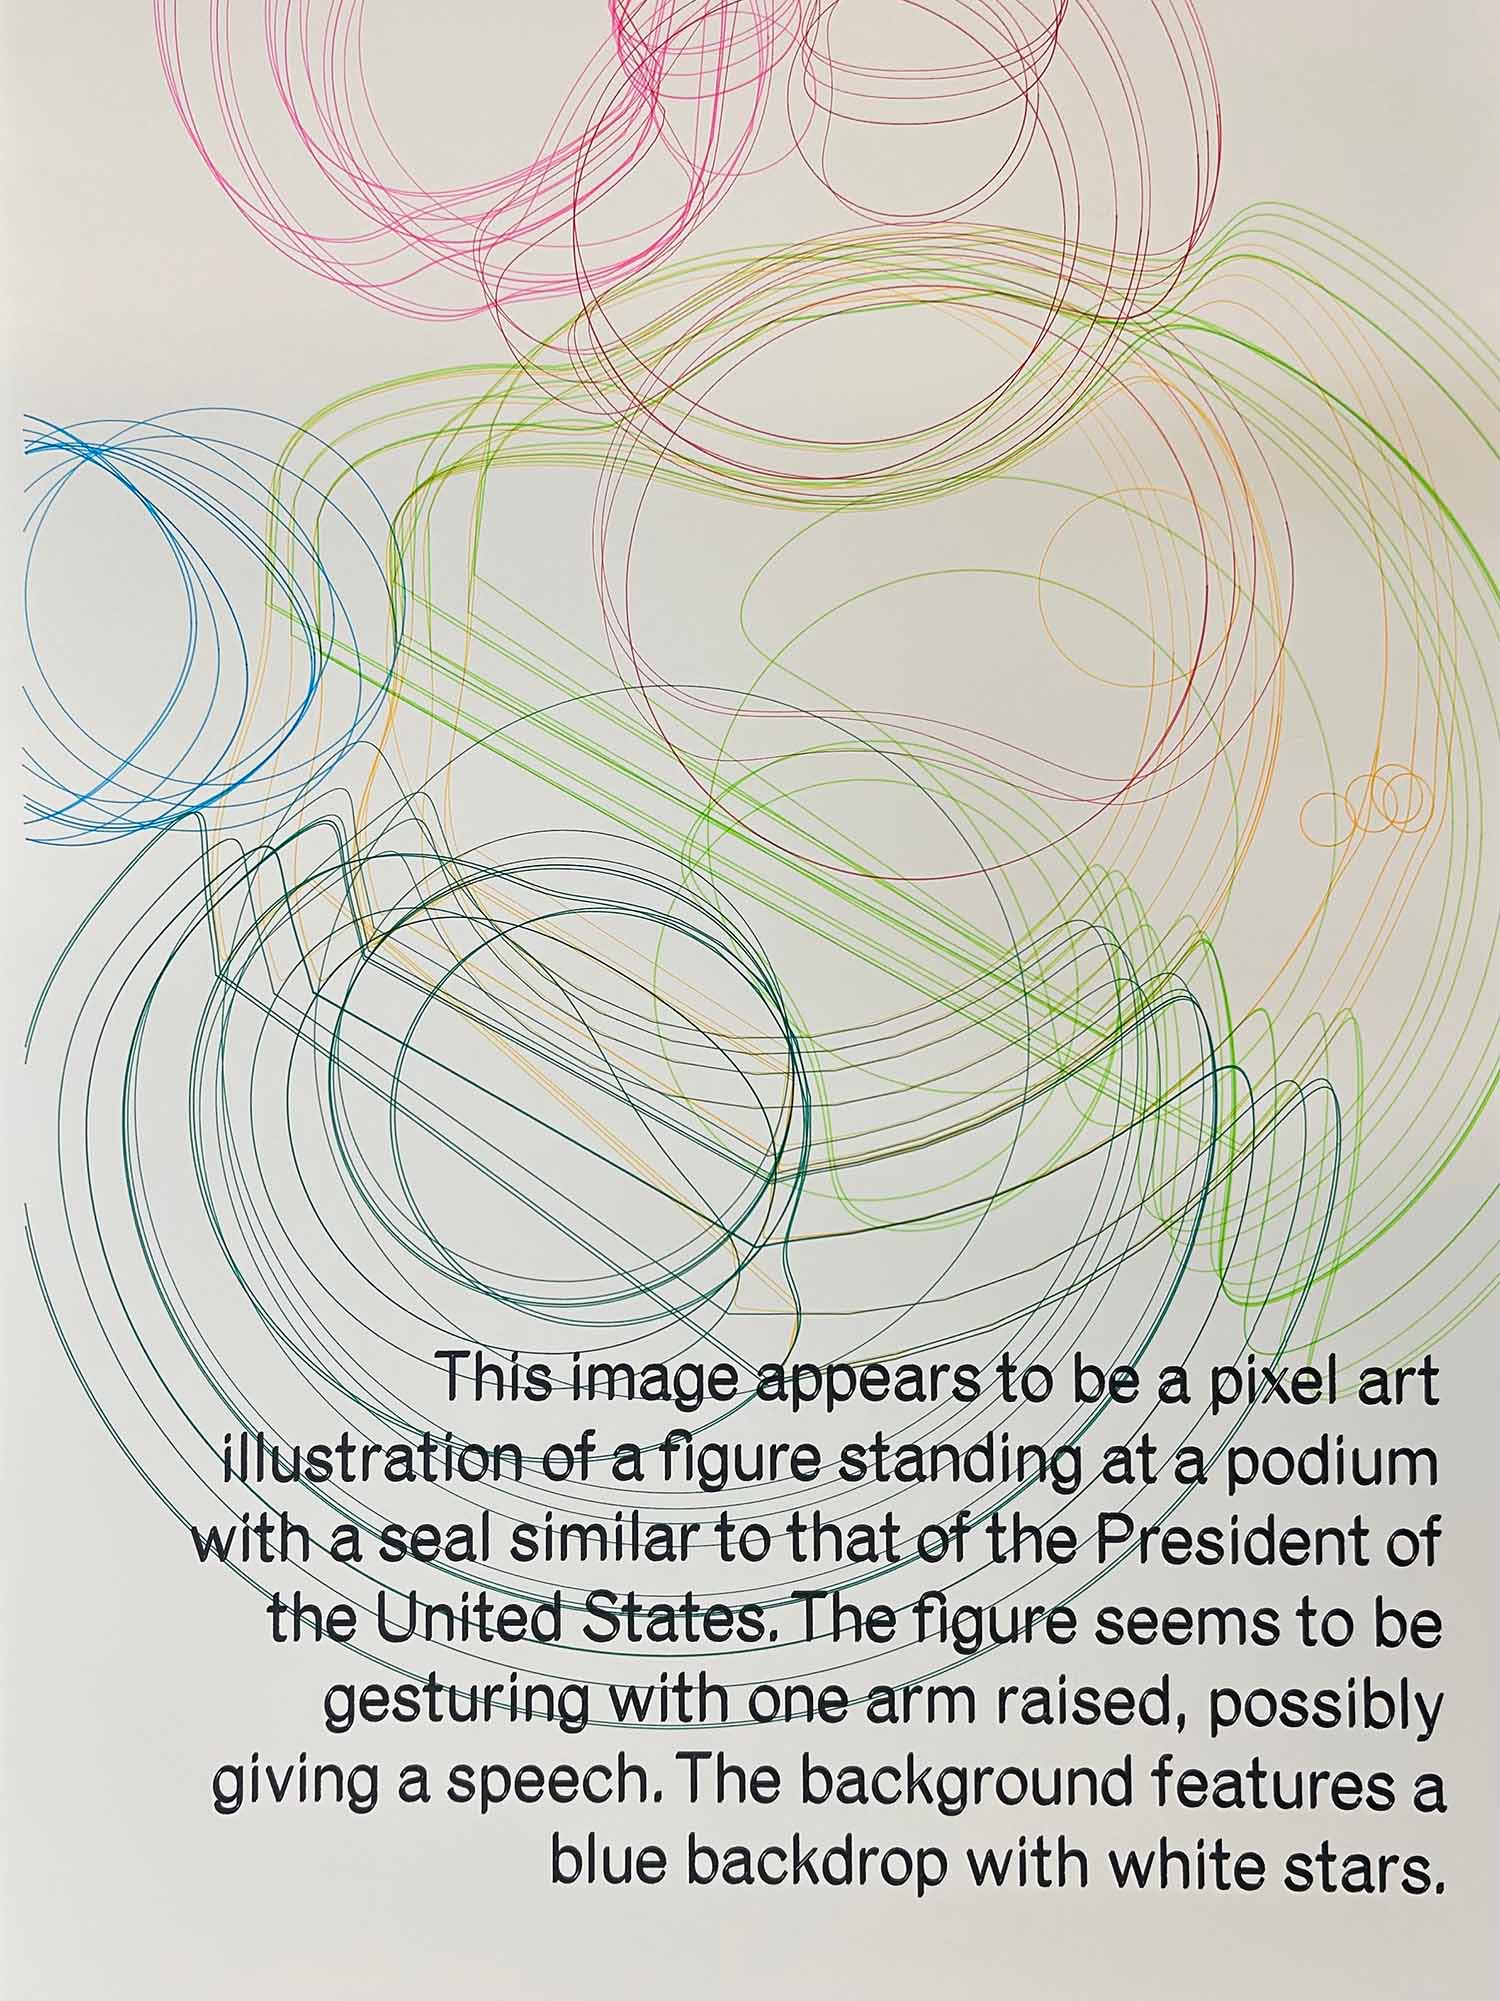
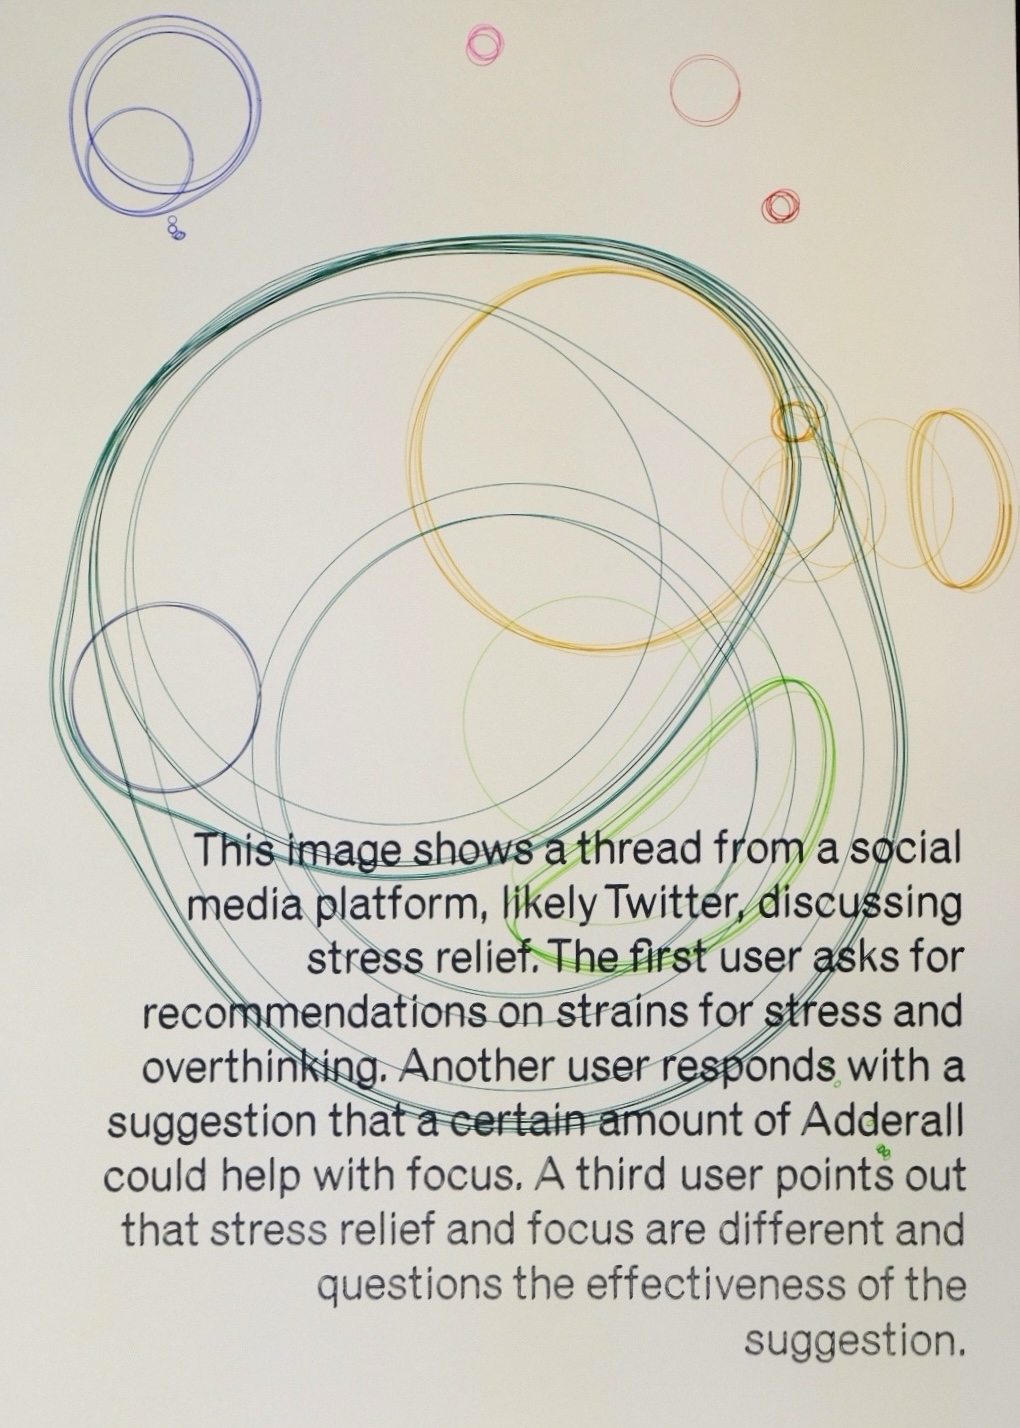
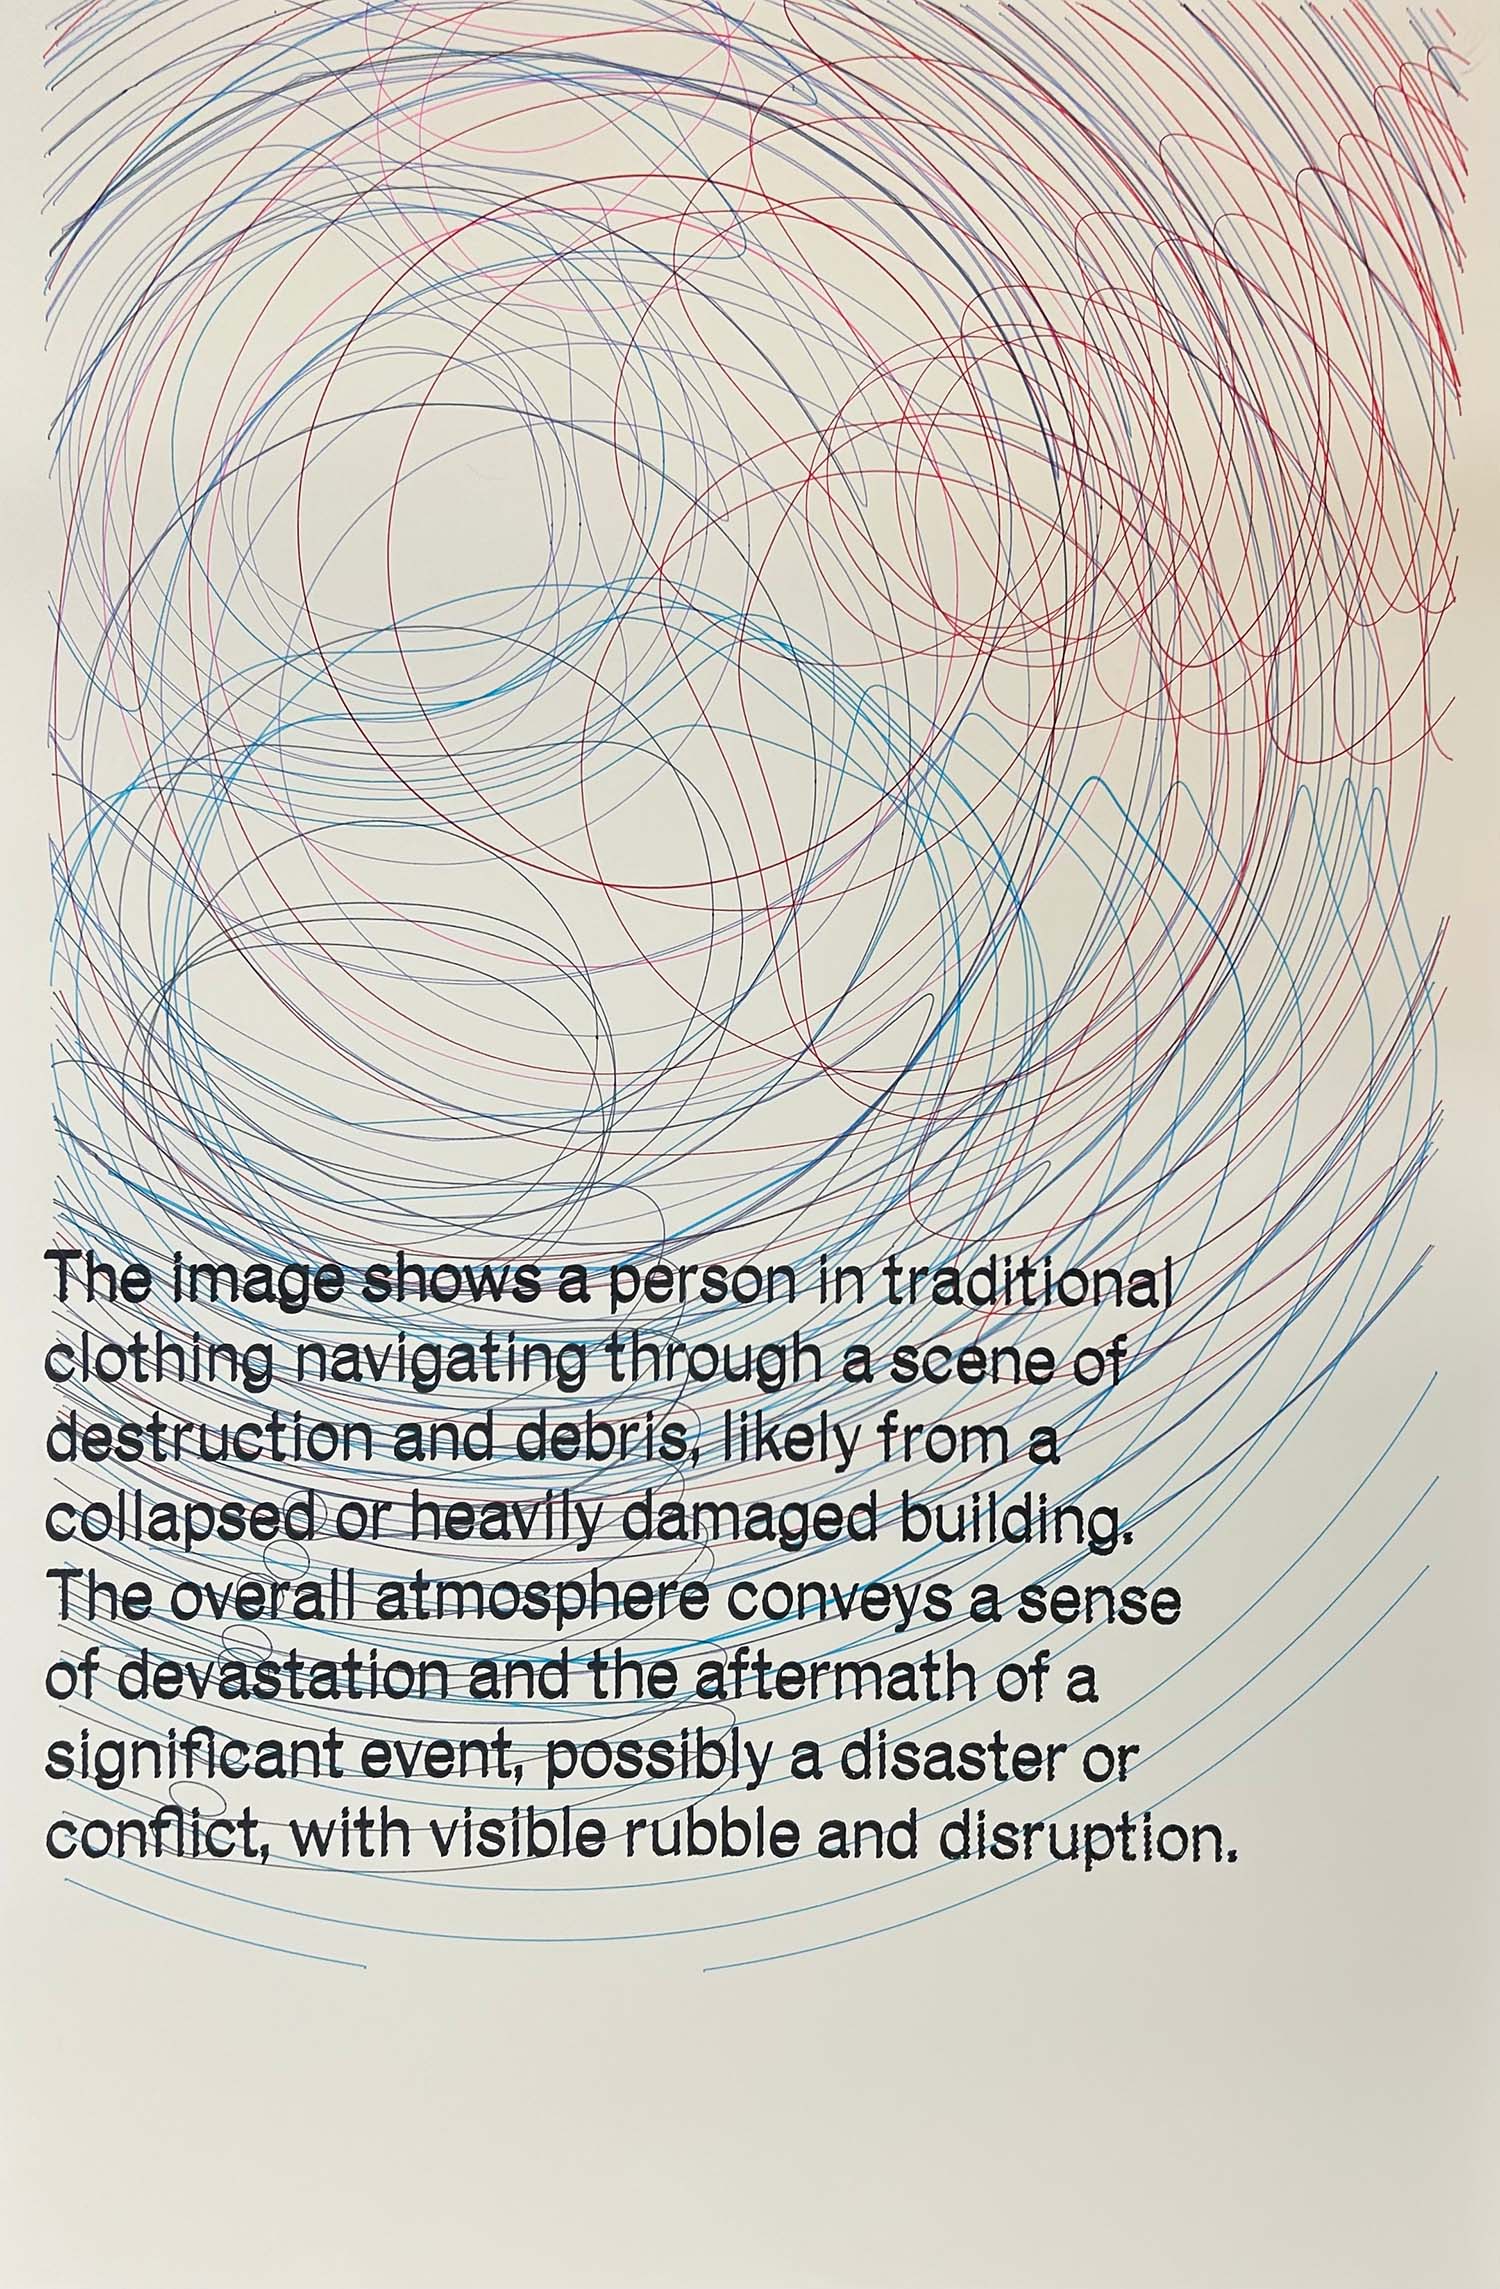
Through Affective Landscapes, the act of tagging affects is visualized as a colorful, abstract field, tracing both the qualities of the tagged affects and their respective intensities. These images prompt you to consider the complexities of your feelings beyond the categories of sentiment analysis. You may see traces of past enjoyment or a swirling sea of dissatisfaction, but your interpretation of these data is yours alone.
A series of these Affective Landscapes produced by a pilot group of participants was exhibited in the Data Fluencies: Tributaries exhibition. This exhibition presented a series of prints that visualize affective data contributed anonymously by participants. Each affect is registered as its own colour, rendered in ink-drop like forms that articulate the affective flows and resonances of algorithmically-recommended images found in Instagram news feeds. These affective imprints are accompanied with algorithmically-generated descriptions of the given images, contrasting the ways in which computational models contend with the affective intensities of images.
DATA/FFECT is Anthony Burton, Matt Canute, Craig Fahner, Ganaele Langlois, Mel Racho and Rory Sharp.
Thank you to the Image-Affect software development team: Matt Canute, Mel Racho, Shane Eastwood, Craig Fahner, Nora Liu, Chancellor Richey, Eli Zibin.
This project is part of the Data Fluencies Project (2022-2025) hosted at the Digital Democracies Institute at Simon Fraser University.
Exhibitions:
April 2025, Boston Cyberarts, Boston MA - Data Fluencies: Rivulets (Curated by Roopa Vasudevan)
May 2025, Or Gallery, Vancouver BC - Data Fluencies: Tributaries (Curated by Roopa Vasudevan)